Manure
Sampling, Nutrient Content, and N Mineralization
N.V. Hue,
Glen Fukumoto, Mike Duponte,
Introduction
I am sure that most of us
enjoy luaus. But can you imagine a luau without meat,
especially roast pork from a suckling pig? My point is that live-stocks are
important to 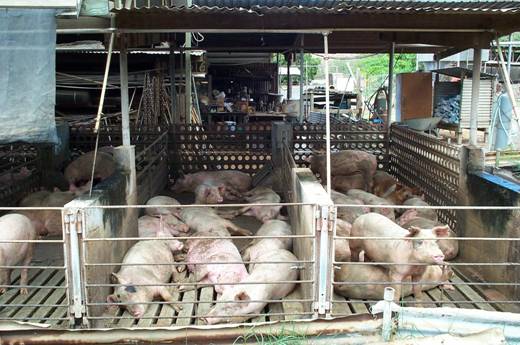
A pig farm
in Waianae,
However, unlike most
tourists, who are only concerned about their tender steaks or juicy pork chops,
we as
How do we manage animal manure? 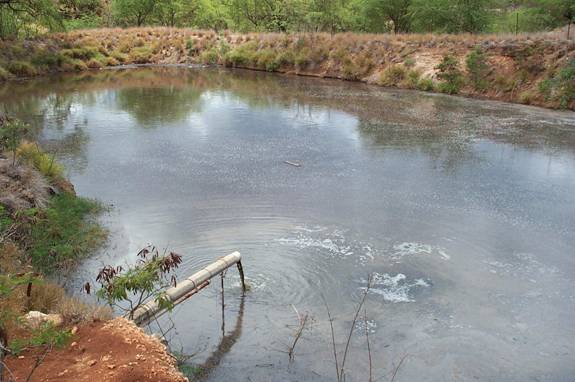
A hog-waste
lagoon in
I believe one of the goals
of this workshop is how to properly manage animal manure. I’m sure several
speakers will provide technical details on how to achieve this goal. In my
opinion, the first step would be (1) proper sampling of manure, (2) accurate
analysis of its content in terms of plant nutrients and perhaps heavy metals,
and pathogens, and (3) knowledge of the transformation/biochemical reactions
that occur when a pile of manure is added to our soil. I hope this presentation
will provide some thoughts for discussion. I will cover three topics: (1)
manure sampling, (2) nutrient composition of different types of manure, and (3)
manure decomposition and nitrogen (N) mineralization.
Manure Sampling
It is logical to expect that
we must have a representative sample of the manure before we can make any sound
decision about its beneficial use or even its disposal. Although the topic of
sampling is important, I won’t cover it much here, because the next session will
deal in more details with sampling protocols.
The key point is that you
need to get a small sample that adequately represents a big manure pile or a
large lagoon. A most often used technique is to sample in a zigzag or W-shaped
pattern. As an example, for a chicken house, walk the entire house and grab 15
to 20 sub-samples with a shovel. Place subsamples in
a plastic bucket and mix thoroughly. Take a small sample from the bucket and
place it in a zipper plastic bag. Double bagging is recommended for safety
reason.

Waste sampling procedure, using a
zigzag pattern. (Adapted from Coffey et al., 2003).

Taking
solid litter sample with a spade or shovel. (Adapted from Coffey et al., 2003).
Sometimes, it is necessary
to divide the facility into several zones or areas, such as brooder versus
non-brooder areas. Sample each area separately.
Manure slurries/effluent from lagoons
The
sampling principle is the same, but the equipment is obviously different.
(1)
Pole and cup method
Here you would need a
plastic cup with a long, 10 to 15 feet, handle. You collect about 10 -12
sub-samples by extending the sampling device toward the center of the lagoon,
and dip a cupful of lagoon effluent. Mix them together in a plastic bucket and
fill a 1-liter plastic bottle to about two-thirds full with the composite
sample. If the lagoon is large, then you may need a small boat to complete the
sampling.

(Adapted
from Coffey et al., 2003).
(2)
Close-end pipe method
The device consists of an 8
to 10 foot long PVC pipe, about 2 inches in diameter, with a rubber ball (about
2 and a half inch diameter, attached by a nylon string inside the pipe).
Collect about 10 -12 sub-samples from different locations around the lagoon or
holding pond. Dip the sampling device within the bottom foot of the storage
structure, into the manure slurry, then pull the nylon
string attached to the rubber ball to seal the slurry within the sampling
device. Empty the content into a plastic bucket, then
collect a small portion of that composite sample. Fill a 1-liter bottle only ½
to 2/3 full because gas will be generated.

(Adapted
from Coffey et al., 2003).
Here is a picture of the
sampling activity by Drs. Evensen and Zaleski.
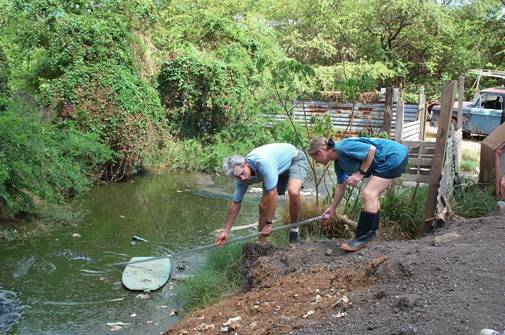
Manure sampling with the close-end pipe
method.
Send the samples as soon as
possible to an analytical lab for nutrient/pathogen analysis. What do we need
to know? In my opinion, at the minimum we need to know percent solids (for
effluent samples) or percent moisture for solid manures, and such nutrients as
N, C/N, P, K, Ca, Mg. You may also need to know about
micronutrients. For example, swine manure may contain high levels of Cu as a
result of Cu supplements in the diet.
Nutrient composition of animal manures
We all know that the manure
composition varies with many factors, including: (1) type of animals: manure
from chickens is usually different from that from cows or horses; (2) kind of
feed consumed: manure from grass-fed cows is unlikely similar to that from cows
in a fattening feedlot; (3) Bedding materials used: straw, saw-dust or soil
would dilute the nutrient content of manures; (4) Method of handling: is the
manure fresh or composted? That makes a difference in terms of nutrient content
and decomposition rate.
Below are some averaged
nutrient contents from local farms. First, let’s look at the nutrient
composition of lagoon effluents.
![]()
Lagoon Effluents
![]() Manure type pH EC N NH4-N P K Cu
Manure type pH EC N NH4-N P K Cu
dS/m ß------------------- mg/L -----------------------à
Dairy 8.2 6.4 396 184 15 1197 0.3
Swine 7.9 5.9 588 566 18 512 0.1
![]()
There are a few observations
that we can make: (1) pH is always alkaline, EC is a bit high by irrigation
water standards, but not too alarming depending on the receiving soils and the
proportion of good water used in mixing before irrigation. (2) Nearly 50 – 95% of total N is NH4,
which averages about 400 mg/L or ppm. (3) Phosphorus
is about 15- 20 ppm, most of it is probably in
organic forms, based on my experience with waste waters.
Next, let’s look at the
manure solids. The dry matter can vary between 35% and 70% (the actual range
was 15-80%), depending on the processing procedures. pH and EC (soluble salts) were
quite high. Some seedling burns may occur if these materials are not properly
applied. Total N and P are usually higher in chicken manure than in cattle
manure, probably due to different feed-stocks and animal physiology. Two key
points that we should notice are (1) the C/N ratio is less than 15 and the N/P
ratio is less than 2. Why are these 2 ratios important? This is because they
may control the rate of N mineralization of the manure and the balance between
N and P requirements and uptake by the plants.
![]()
![]() Manure Solids
Manure Solids
M. Type DM pH EC C N P K Cu C/N N/P
% dS/m ß-------- % ----------à ppm
Dairy pen 71 8.7 20 28 1.9 1.0 2.4 120 14.7 1.9
Chicken 35 7.9 30 27 3.2 2.8 2.0 88
8.4 1.1
Swine pen -- -- -- -- 2.1 2.6 0.5 90 -- 0.8
![]()
Another question you may ask
is: Are manures from animals raised in
Here are some data from the
literature (Eck and Stewart, 1995) to support this conclusion.
Nitrogen, phosphorus,
potassium, all seem to be similar to the local values.
However, the local manures seem to contain a bit higher Cu than those reported
in the literature. Personally, I don’t think this is a concern, because (1)
most of Cu in manures is probably in organic forms, which are much less toxic
to plants and animals than Cu 2+, (2) swine manure can contain as
high as 600 ppm Cu, and (3) The EPA limit of Cu in
human bio-solids and animal manures for land applications is 1500 ppm (EPA, 1994).
Manure type DM N P K Cu
![]() ß-------------- % -----------------à ppm
ß-------------- % -----------------à ppm
Broiler litter 31 2.3 1.1 1.7 29
Hen litter 43 2.0 1.9 1.9 31
Dairy cow 11 2.7 0.5 2.4 28
Fattening cow 10 3.5 1.0 2.3 23
Hog 29 2.0 0.6 1.5 18
Horse 28 1.7 0.3 1.5 19
![]()
Manure decomposition and nitrogen
mineralization
Decomposition is defined as
a process in which manure carbon is released by microbial actions to gaseous CO2.
For example, carbohydrates in (sugar components of) the manure can be oxidized
to H2O and CO2 as shown in this simplified reaction:
C6H12O6 +
6O2 ===è 6H2O + 6 CO2 + energy
Because of decomposition,
manures can lose much of their weight if given enough time and favorable
microbial populations. Nitrogen content of the decomposed manure is usually
higher than that of the “initial” or fresh manure. This is because much more C
would be lost as CO2 than N as NH3.
Nitrogen mineralization, on
the other hand, is the conversion of organic N, mostly proteins, into inorganic
N such as NH3 (or NH4 in the presence of water) and NO3.
This process also requires microbial actions. Generally, microbes break down
proteins into amino acids with the aid of appropriate enzymes. These amino
acids, in turn, are incorporated into microbial cells, using organic carbon as
the energy/substrate source. However, if the readily oxidizable
C source is low relative to the amino acids, then the excess amino acids will
be oxidized to NH3 as shown here:
CH3CHNH2COOH + ½ O2 ====è CH3COCOOH +
NH3
Alanine
(amino acid) Pyruvic (organic
acid)
 Thus, the C/N ratio of manures and manure-amended
soils is important to the N mineralization process. Values of C/N < 15 strongly favor this
process (Hue and Sobieszczyk, 1999).
Thus, the C/N ratio of manures and manure-amended
soils is important to the N mineralization process. Values of C/N < 15 strongly favor this
process (Hue and Sobieszczyk, 1999).

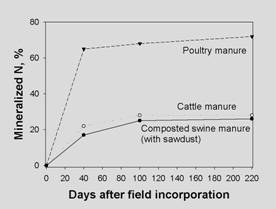
Organic C released and organic N mineralized from
manures in a short term (< 1 year). Taken from Shiga,
1997.
Please keep in mind that
manure decomposition in soils (as measured by CO2 production) does
not necessarily coincide with N mineralization in the short term (say, a few
months or a growing season).
Dr. H. Shiga from the
Research and
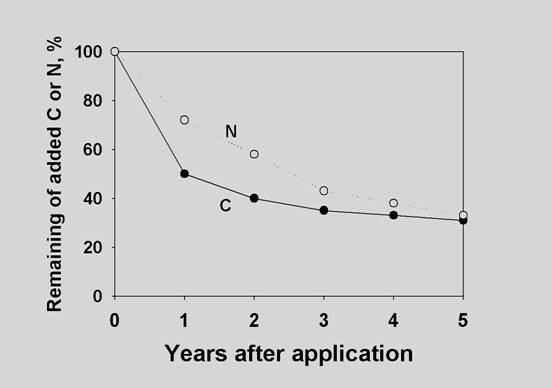
Organic C released and organic N mineralized from a
cattle manure applied
to upland rice soils in
You may ask next: how fast
would organic N from the applied manure become NH4 and/or NO3?
Frankly, I do not have any good answer to this question, because of the
following reason. We all know that the decomposition and N mineralization of a
manure when applied to a soil depends on many factors, including (1) manure
properties (C/N ratio, as an example) and its application rate, (2) soil
properties (pH, toxic metals, moisture, temperature), and (3) interactions
between the manure and the soil. So site-specific studies
would be required to get an accurate prediction of N supply to a crop or the
potential leaching of NO3 from manure applications. On the
other hand, some general estimates of N mineralization rate have been provided
to guide both growers and environmental regulators. For example, the USDA has
put out a field guide of waste utilization (Part 651, 1996) with these numbers
(extracted from Table 11-9).
![]()
![]() Manure
Type Years
after initial application
Manure
Type Years
after initial application
1 2 3
ß % N available (accumulative) à
Fresh poultry manure 90 92 93
Fresh swine or cattle 75 79 81
Swine or cattle manure 65 70 73
Stored in
covered storage
Effluent from lagoon or 40 46 49
Diluted waste
storage pond
![]()
I suppose, as an
environmental regulator, I would be more concerned about NO3
pollution of waters, so I would use the upper-end of the N mineralization range
to play it safe in protecting the environment.
On the other hand, as a crop
grower, I would use the lower-end of the N mineralization scale to ensure that
my crops have enough N as shown in the following table extracted from a popular
soil science text book (Brady and Weil, 1999).
![]()
![]() Manure
Type Years
after initial application
Manure
Type Years
after initial application
1 2 3 4
ß------ % N available (accumulative) -----à
Poultry floor litter 50 65 73 76
Dairy (fresh solids) 35 53 62 66
Swine manure, lagoon liquid 50 65 73 76
![]()
The fact is that either end
of the N mineralization scale can be selected, depending on your philosophy and
purposes. However, be sure to do some experimental work to support/validate
your selection. Some experimental results from Dr. Shiga’s work in
Rate of N
mineralization 8-12 months after manure applications to upland rice soils in
![]()
Manure type C/N
ratio % N mineralized
![]() of manure in soil
of manure in soil
Poultry (1 year) 10.7 61
Swine (8 months)
9.8 61
Cattle (8 months) 15.8 30
Cattle (1 year) 20.3 47
![]()
There
are also many mathematical models and computer programs to help you predict N
mineralization rate. One of such models
uses first order kinetics of the form: Nm = N0[1
– e –kt]
Where
Nm is the amount of N mineralized at a specific time t, and N0 is the mineralization
potential at time zero, k is the rate
constant. N0 and k must be
experimentally determined, usually by incubating the manure of interest with
the target soil for several weeks (24 – 30 weeks), and periodically measuring
the amount of NH4 + NO3 released.
An example is the work of Chae and Tabatabai (1986) at
In summary, as residents of
Who says there’s no hard
work in paradise,
References
1.
2. Coffey, R.D., G.R.
Parker, K.M. Laurent, and D.G. Overhults. 2003.
Sampling animal manure.
3. Eck, H.V. and B.A.
Stewart. 1995. Manure. p. 169-198. In: J.E. Rechcigl
(ed.) Soil amendments and environmental quality. Lewis
Publishers,
4. EPA. 1994. A plain
English guide to the EPA part 503 Biosolids rule. EPA/832/R-93/003.
5.
6.
7. Shiga, H. 1997. The decomposition of fresh and composted organic materials in soil.
Food and fertilizer technology center, Ext. Bull. 447.
8. USDA. 1996. Pert 651. Agricultural waste management field handbook. Chapter 11.
9. Chae,
Y.M. and M.A. Tabatabai. 1986. Mineralization of
nitrogen in soils amended with organic wastes. J. Environ. Qual.
15:193-198.