Summary
Mākaha Valley
Invasive Species
Remote Sensing Basics
Model
Model Results
Map
Vegetation Map Results
Derived Map Results
Links
Acknowledgments
References
|
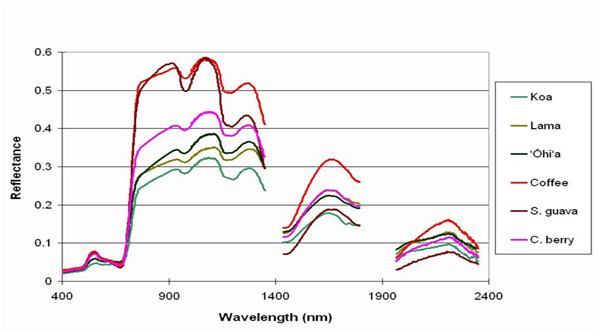
Average canopy reflectance
The figure below shows average canopy reflectance derived from the model. Note that nonnative species tend to have higher reflectance through 1400 nm. Reflectance behavior changes in the SWIR regions (beyond 1400 nm). Although species reflectance decreases after 1400 nm, and species differences also tends to decrease, the SWIR regions still provide valuable information.
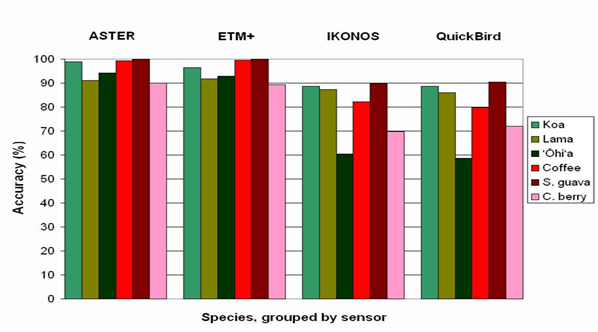
Species classification accuracy
The figure below shows the accuracy that the four sensors have in detecting a target species in a simulated forest containing the other five species.
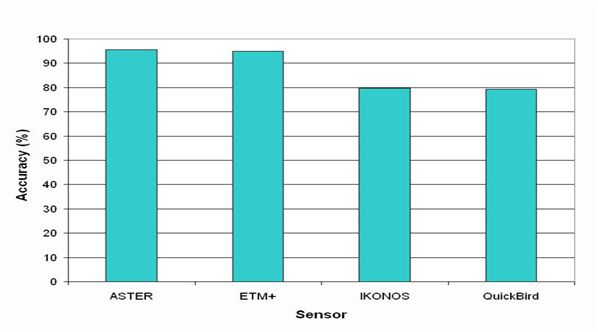
Overall classification accuracy
The figure below shows the overall classification accuracy for the four sensors. ASTER and Landsat ETM + contain bands in the SWIR region, while IKONOS and QuickBird do not. All accuracies are high, indicating that remote sensing is a valuable tool for vegetation classification in Mākaha Valley.
|
|
|
University of Hawai‘i at Mānoa. Last updated 2009-03. Contact email: tomoakim@hawaii.edu |