Summary
Mākaha Valley
Invasive Species
Remote Sensing Basics
Model
Model Results
Map
Vegetation Map Results
Derived Map Results
Links
Acknowledgments
References
|
Vegetation mapping results
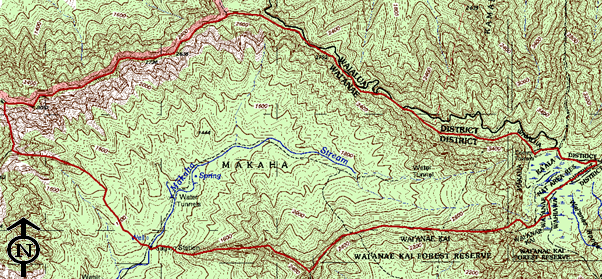
The topographic map below, with the study area outlined in red, can be used to better understand the location of the vegetation communities shown in the classification maps. The elevation ranges from approximately 296 m (971 ft) at the USGS gaging station in the southwest corner of the site to 1227 m (4026 ft) at Mt. Ka‘ala in the East.
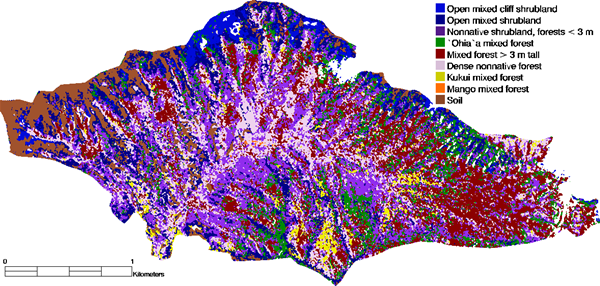
The image below is the vegetation map which we derived from the IKONOS image and field data. The map classes have been statistically filtered in order to remove small patches of map communities.
The map above shows large areas of ‘ōhi‘a forest (in green) on Mākaha’s north-facing slopes. The IKONOS data also showed good results in detecting small stands of ‘ōhi‘a forest which can be found in the highly invaded south-facing slopes and in the back of the valley. The vegetation classification was also successful in showing the highly invaded communities (in pink) found at elevations where cattle grazing and human habitation historically occurred.
The table below shows some of the common overstory species found in our map classes. Notice that strawberry guava is found in most of the classes. Remember from the modeling results that strawberry guava had a very high reflectance and was easy to find using satellite data. However, the model does not take all real-world situations into account. In the field, strawberry guava can be found as scattered shrubs or as monotypic, dense shrubland. It can also be found as forests that reach 6 m (20 ft) in height or as dense stands of saplings around 2 m tall (less than 7 ft tall). These differences in height and density of leaves will greatly affect the amount of light measured by the satellite. This complicates isolating some species into one map class.
Map color |
Map class |
Common overstory species |
Total area (ha)* |
| Lt. blue |
Open mixed cliff shrubland |
Christmas berry, grasses |
21.30 |
| Dk. blue |
Open mixed shrubland |
‘a‘ali‘i, C. berry, ‘ōhi‘a, strawberry guava |
77.71 |
| Purple |
Nonnative shrubland and forest < 3 m tall |
C. berry, coffee, s. guava |
26.18 |
| Green |
‘Ōhi‘a mixed forest |
koa, lama, ‘ōhi‘a, s. guava |
55.43 |
| Red |
Mixed forest > 3 m tall |
Australian red cedar, silk oak, s. guava |
114.19 |
| Pink |
Dense nonnative forest |
C. berry, mango, s. guava |
91.78 |
| Yellow |
Kukui mixed forest |
kukui |
13.28 |
| Orange |
Mango mixed forest |
Java plum, mango, silk oak |
0.24 |
| Brown |
Soil |
N/A |
46.13 |
*1 ha (hectare) = 10,000 square meters, or 107,639 square feet
A point worth noting here is that the classification maps are not 100% accurate. Due to, for example, the variation found in nature, the limitations of the sensor, and the errors introduced during the analysis process, the map cannot be 100% accurate. This is why the accuracy assessment results are important. Overall accuracy for our map was 80%.
|